Preamble
I have a few personal projects that might grow into more in the future. They’ve been running for the good part of a year or so and have amassed a LOT of entries.
I want to collect a large table of historic info collected daily or hourly so I can graph and check things over time. These projects have worked great for my use cases, and Clickhouse was a good choice - So I thought…
My first Clickhouse project tracks historic views for videos periodically and is at 64,390,688 rows. The table size is 156M, and the project uses a full 82GB on disk. The second grows much faster, periodically - collecting item details and image URLs, with historic prices in another table. I haven’t used this much, and I’m happy I haven’t. This is sitting with 64,390,688 rows (156M table size) for the price history, and 99,516 rows (6M table size) for the product table, using a full 94GB. Yikes.
While I hadn’t noticed the disk usage until now, what I did notice was the system usage from each clickhouse docker container.

That’s a process with 730 threads, using 550-600MB RAM at rest. I usually see 0.5-4% CPU% (overall) which isn’t crazy on an 8-core i7-7700, but it’s far more than Postgres’ usual 0.0% + 1 thread + 50-200MB RAM combo. There is NOTHING (user-initiated) happening. This usage is to keep answers fast, and it’s by design.
Yes, threads can be inactive doing nothing, but they are there just existing. I like low numbers, it means I can do more with this system, or it can handle more when asked of.
This server isn’t a dedicated database machine. Assuming you’re using a free-tier VM, shared CPU or more, Clickhouse might not be the best choice.
As for Postgres? I’ve used it forever. Low system resource usage overall, and rock-solid reliability. I haven’t worked much with PG extensions, and originally chose Clickhouse over TimescaleDB after reading into it… But I think I may have chosen incorrectly.
For a service you can use at scale paying for them to host it, it’s probably still a good choice, but for my self-hosted projects - especially those which don’t need to scale infinately or will be used by a handful of users, if not just me, it’s not my first choice anymore.
Migrating
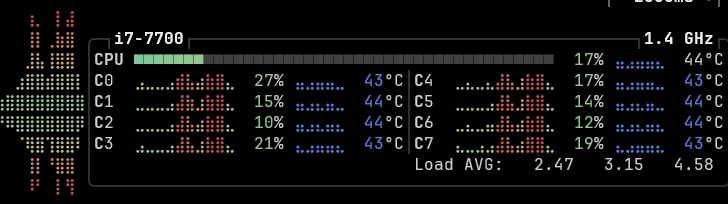
There’s a lot. I’m migrating 10,000 rows per entry from Clickhouse to TimescaleDB. My CPU is well saturated – by Clickhouse.



You can see my TimescaleDB Postgres 18 server is ingesting this workload currently at 36,890,000 + 10,000 per second or two - happily using almost nothing. My Clickhouse 25 (yes, there’s a 26, but it’s an on/off project for me and I don’t think perf would be THAT different) is using 1.4GB RAM with 35-40% CPU consistently.
Using 5k rows in each read chunk we’re using around the same CPU and progressing at the same speed, if not slower. Changing to 100k read chunks, Clickhouse still uses a solid 55-65% CPU usage across all cores, but does seem to speed up the process quite a bit. Putting much more into TimescaleDB has Postgres at a sweltering 7-8.5% CPU using 299MB RAM. This massive influx in requests even strained Postgres to the point of usng 300MB RAM, raising by 1MB for every ~10,000,000 rows.
Maybe I’m being too harsh on Clickhouse, and single massive calls for 10 million rows at a time is more expected than many calls for tens of thousands. For my use case, I’m checking a few days at most of history keeping up to a few months of entries, so I’d never reach such highs. Asusming I opened the project to more, we’d still be making calls for a few hundred rows at a time, not millions.
For the last ~15 million rows, CPU usage from Clickhouse dropped to 1-8%, which was surprising. Maybe older content is compressed or stored in another fashion? It did taper off quite nicely over the ~5 minute graph.

Post-Migration
Upon completion, we’re back to an idle 630MB + 1-3% CPU usage in Clickhouse, and TimescaleDB using 19MB RAM + 0.0% CPU.
Performance benchmarking and optimization
Visiting my internal video website scans for the latest view count for every video, compures a 4-hour baseline and returns the top 50 views by growth. A full table scan of views_history. While this isn’t super-optimal I use this at most once or twice a week, so it’s fine for a stress-test.
Loading my webpage using Clickhouse I see a spike for a second or two to 100%:
Using hey to benchmark 25 requests on localhost I see almost pinned 80% CPU with results:
| |
Using Postgres/TimescaleDB with an almost identical worst-case query setup I see:
Well, nothing. The page never loads. TimescaleDB is pushed to 12.6% CPU and 385MB RAM, but nothing happens… A single thread is maxed-out at a time.
Both Clickhouse and Timescale are requested to walk EVERY entry in the 64M row history table because of argMax being used in my Clickhouse query, and DISTINCT ON ... ORDER BY on my Timescale query.
The argMax is a streaming aggregate in a single columnar pass across all cores. Postgres’ DISTINCT ON sorts the full 64M row table with a composite index and forces a full index scan - Single-threaded and incredibly slow. Both technically O(n), Postgres using 1 core only for this makes it unusable.
Moving away from a mostly 1-to-1 copy of the query to a LATERAL approach that uses index lookups per video instead of a full scan (Each video doing one B-tree probe for the latest view and one for baseline) - O(num_videos * log(history_rows_per_video)):
| |
From 4 seconds to 26+… Still, not a wholly fair comparison. For crunching numbers from millions of rows, Clickhouse has it beat, but…
If we switch to using a table with the latest video count for every video (A row for every video tracked) as a lookup table, and then pulling the historic views for specific videos we’re interested in we now have O(num_videos + num_videos * log(history_rows_per_video)). We’re filtering for changes over a day or two and not the entire history so that shrinks things a lot.
| |
The process has changed fundamentally, it’s a lot faster for my workflow.
But that’s not all bad. Clickhouse is optimized for the thing a lookup table avoids. Clickhouse managed a full scan infinately faste than PostgreSQL can.
If we disable auto-vacuum on our hypertable as it’s append-only we can save on what little CPU postgres uses in the background. If we add a covering index for the B-tree (video, timestamp DESC) we can skip the heap read and go straight from index probe to getting view counts, saving even more time.
| |
And while I could do even more to speed things up like periodically preparing and caching results to show… It’s a project just for me to make things a little easier that I check once in a while. This is not specifically faster for me on the user-end, but on the back-end it’s way less painful to deal with.
TimescaleDB system resources
While idle we’re now using 37MB RAM and 0.0% CPU. It’s used when I hit it, or update it. Not a consistent usage keeping Clickhouse on its toes. TimescaleDB uses 11GB on disk, down from 82GB. While it collects data every few hours, I can prune past entries down to just one or 2 per day saving a lot of space. There’s probably some more compression magic we can use too, but for now and the next 6 years it’s fine (assuming 1 year to reach 80GB for Clickhouse, and the postgres table grows at a similar rate), but we have yet to see.
After migrating my second DB from Clickhouse’s 94GB we’re now at 554MB which sounds insane, but checking the data… It’s all there. Insanity. I would assume most of that space usage is for performance boosts of sorts?
Afterword
Clickhouse has it’s uses. Yes, it’s insanely fast for checking millions of rows and coming up with aggregate answers, and if I have a use case where I need to display millions of rows of data, I’d use it. If you’re ingesting millions of logs a minute, or other data then it’s a fantastic choice. Incredibly high performance with massive throughput, but it uses system resouces where available – For everything else it’s probably very overkill when we can otherwise process data down into smaller chunks or access only portions or snippets from a much bigger history, like above.
If you’re not hosting it yourself and you find the paid service comparable, then it’s also a good choice.
For my specific self-hosted use-case I need low storage usage, and low performance overhead. If it takes a little longer or requires a little more thinking, that’s fine by me.